Case study · Fibro Plasma Perth — Ana Belen
From 42 to 324 daily AI impressions in 92 days
An evidence-led account of AI-feature visibility and standard Search performance for a Perth cosmetic clinic.
Published 22 September 2026 · Updated 22 September 2026 with primary visual evidence · Data period: 21 June–20 September 2026 · Search Console export: 22 September 2026
The result in brief
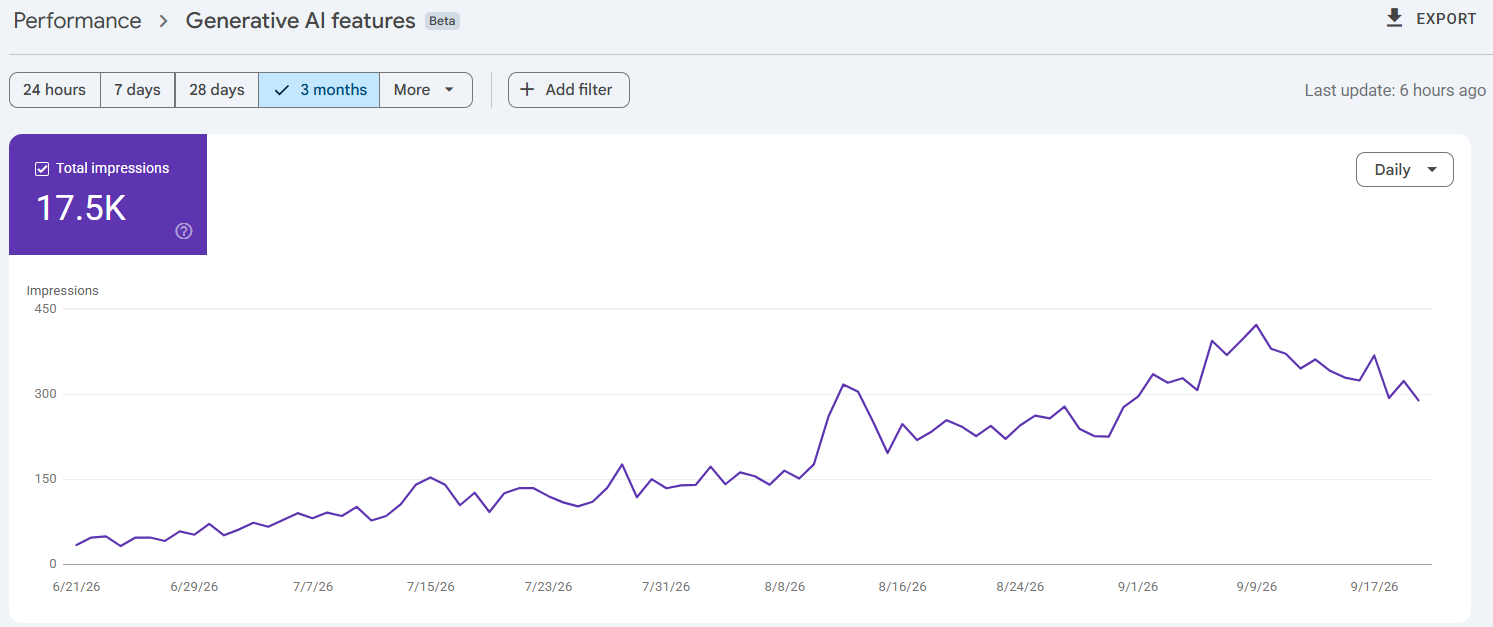
The report recorded 17,483 impressions in Google’s generative AI features. Daily averages moved from 42 in the first week to 324 in the final week. These are impressions, not clicks from AI answers, and the observation does not establish a guaranteed causal result.
Starting point
Fibro Plasma Perth had an established website and treatment expertise. The first week of the measured period averaged 42 daily appearances in Google’s generative AI features. That dated baseline is the comparison point used here.
What Canvas worked on
Canvas developed the website and organised treatment, healing, aftercare and comparison information around questions people actually ask. The work combined technical SEO, clear page structure, original clinic information and internal links. This was not a controlled experiment, so the results are reported as an observed change rather than proof that one action caused it.
Primary generative-AI report evidence
The source image below is the supplied Google Search Console Generative AI features report. It did not contain an account name, email address or property selector, so no redaction was needed and the reported chart was left unaltered.
Written transcription
Visible controls and labels read “Performance”, “Generative AI features”, “3 months”, “Total impressions”, “17.5K” and “Daily”. The horizontal axis runs from 21 June 2026 into September, ending after the 17 September marker. The line begins below 50 daily impressions, trends upward through July and August, peaks above 400 in early September, and finishes around 300.
The screenshot supports the rounded 17.5K total and overall trend. The exact 17,483 total and the 42-to-324 first-week/final-week averages are transcribed from the supplied analysis; those exact figures are not printed in the screenshot itself.
What the exports show
| Measure | Observed value |
|---|---|
| Generative AI impressions | 17,483 (17.5K rounded in the source image) |
| Monthly daily averages | 48 late June · 108 July · 218 August · 345 (1–20 September) |
| Peak AI impressions | 422 on 9 September 2026 |
| Pages cited in AI features | 62 |
| Countries with AI visibility | 151 (Australia 36%) |
| Mobile share | 76% |
| Standard Search | 1,471 clicks / 55,286 impressions |
| Standard Search daily clicks | About 8 → 26 (first vs final 14 days) |
| Average position | 17.2 → 9.3 (first vs final 14 days) |
Most-cited pages in Google’s generative AI features
Guides answering practical questions produced the largest page-level counts. One AI answer can cite several pages, so these figures must not be added together.
| Page topic | AI-feature impressions |
|---|---|
| Healing time guide | 4,022 |
| Aftercare guide | 3,486 |
| Homepage | 2,060 |
| Treatment page | 1,666 |
| How long results last guide | 1,430 |
A separate comparison page received 486 of its 635 search impressions from AI answers: 77% of that page’s measured search visibility.
Method and source
The analysis uses a Google Search Console report screenshot and exports supplied on 22 September 2026 for the 92-day period from 21 June to 20 September. The screenshot identifies the report as Generative AI features and shows the rounded total and daily trend. The page-level generative-AI export contains 62 cited URLs. Generative-AI-feature measures are presented separately from the standard Web Search export. First-versus-final comparisons use the periods stated beside each metric.
Limitations
- Search Console reports impressions, not clicks from AI answers.
- The screenshot rounds the total to 17.5K; it does not print the exact total or weekly averages.
- Page-level counts cannot be added to reproduce the total because one AI answer can cite several pages.
- The comparison is observational, not a controlled experiment.
- AI platforms change their interfaces and reporting.
- No ranking, citation, indexing or traffic outcome is guaranteed.
As seen in
Barchart
USA TODAY
USA only — these press-release links require a US IP address.